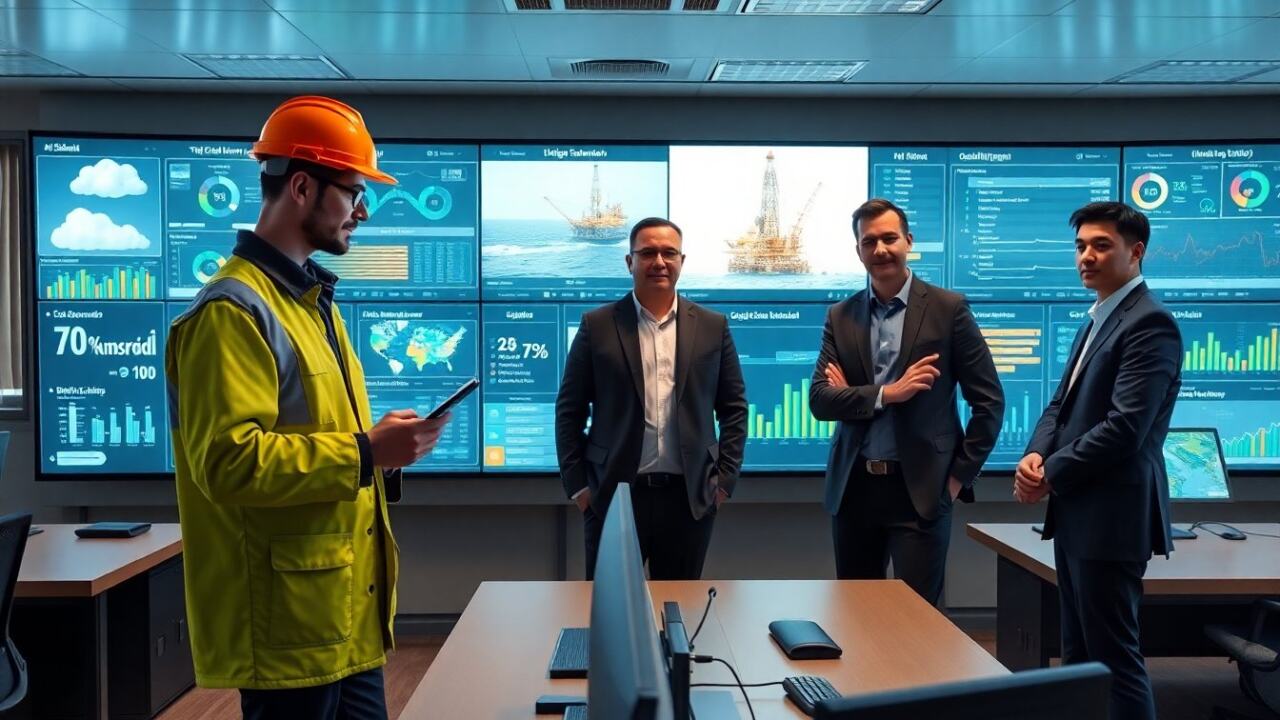
Digital transformation in oil and gas gives operators clear paths to cut costs and raise uptime. Companies apply sensors, cloud, and models to spot faults early. Teams reduce downtime and improve safety by using real data. This article explains the key technologies, high-impact use cases, a practical roadmap, and how firms measure results in 2026.
Key Takeaways
- Digital transformation in oil and gas leverages sensors, cloud, and machine learning to reduce costs and increase uptime effectively.
- Remote monitoring and predictive maintenance improve safety and operational efficiency by anticipating equipment failures before they occur.
- Downstream optimization through refinery automation, logistics enhancements, and demand forecasting boosts production yield and lowers fuel and inventory costs.
- Implementing digital transformation requires starting with clear goals, running manageable pilots, and scaling solutions with strong data governance and staff training.
- Tracking KPIs such as uptime, safety incidents, and ROI ensures continuous improvement and aligns digital initiatives with business objectives.
Why Digital Transformation Matters Now For Oil And Gas
Oil and gas firms face tight margins and stricter safety rules. Digital transformation in oil and gas helps firms lower operating costs and meet rules. Remote assets gain sensors and connectivity. These changes let teams find leaks, avoid hazards, and run equipment longer. Investors expect clear performance data, and customers demand cleaner output. Firms that adopt digital tools report faster decisions, fewer incidents, and steadier production. Regulators and markets also push for transparency. In sum, the shift gives operators tools to protect people, assets, and cash flow.
Beyond immediate cost and safety benefits, the sector is responding to longer-term shifts: more volatile commodity prices, stricter emissions targets, and a growing mix of traditional and renewable energy sources on the grid. Digital initiatives enable better scenario planning, faster operational pivots (for example, adjusting throughput or flaring schedules), and improved lifecycle management of assets. They also create the data fabric needed for sustainability reporting, emissions monitoring, and compliance. For many operators, digital transformation is no longer a competitive advantage but a necessary capability to manage complexity, reduce risk, and capture incremental value across exploration, production, refining, and distribution.
Core Technologies Powering The Shift
Sensors and IoT deliver real-time readings from wells, rigs, and tanks. Edge systems collect those readings and send summaries to cloud platforms. Cloud services store data and run analytics at scale. Machine learning finds patterns that human teams miss. Digital twins create a live model of assets and processes. Automation systems run valves and pumps with simple rules. Cybersecurity tools protect data and control systems from attacks. Integration software links legacy control rooms to new platforms. Each technology serves a clear role: sense, move, analyze, and act.
Drilling into specifics, the technology stack typically includes: rugged field sensors (pressure, temperature, flow, vibration, corrosion), edge compute nodes that filter and preprocess signals to reduce bandwidth, secure networks (private LTE/5G, satellite comms for remote sites), cloud data lakes and time-series databases, model deployment frameworks for ML inference, and orchestration layers to translate analytics into control actions or operator alerts. Equally important are middleware and APIs that bridge OT (operational technology) systems like SCADA/DCS with IT analytics platforms. Finally, identity, encryption, and network segmentation are core cybersecurity controls to protect both data and physical processes from intrusion or accidental misconfiguration.
High-Impact Use Cases
Operators focus on use cases that show fast value. The top areas include upstream monitoring and maintenance, and downstream optimization with better logistics and forecasting. Teams run pilots on single fields or refineries, measure gains, then scale the solutions. The cases below show common steps, typical benefits, and realistic results operators can expect.
Upstream Optimization: Remote Monitoring, Predictive Maintenance, And Drilling Automation
Remote monitoring gives engineers live views of wells and rigs. Remote sensors stream pressure, temperature, and vibration. Analysts feed that data to models that predict failures. Predictive maintenance then schedules repairs before parts fail. Drilling automation uses control algorithms to keep drills on target and cut nonproductive time. Operators reduce unplanned downtime and lower repair costs. They also improve safety by keeping workers away from risk zones. Together, these steps raise production per asset and shrink total operating expense.
Practically, upstream projects often start by instrumenting a critical well or well cluster, validating sensor fidelity, and building baseline models for equipment behaviour. Typical early wins include reducing workover trips, improving pump run-times through optimized setpoints, and lowering non-productive time during drilling through automated steering adjustments. Equally important are integration steps—feeding well performance signals into production forecasting models and into reservoir management systems so decisions reflect both short-term operations and long-term field plans.
Downstream And Supply Chain: Refinery Optimization, Logistics, And Demand Forecasting
Refineries use sensors and models to balance crude blends and energy use. Optimization systems suggest set points that increase yield and cut fuel use. Logistics teams track shipments with GPS and telematics. They plan routes and loads to lower transit time and fuel cost. Demand forecasting uses sales data and external signals to predict volumes. This reduces inventory and improves margins. Firms that link refinery control to logistics and forecasting gain smoother flows and higher throughput.
High-impact downstream projects often combine process optimization (advanced process control, model predictive control) with digital supply chain tools (real-time tracking, dynamic scheduling, and automated inventory rebalancing). Use cases include reducing catalyst spend through tighter control of reaction conditions, minimizing blending losses by optimizing feed ratios, and cutting demurrage by synchronizing vessel arrivals with processing capacity. When forecasting and market signals are integrated into scheduling systems, planners can shift product mixes more quickly to capture margin opportunities while avoiding overstock.
A Practical Roadmap For Implementation
Leaders start with clear goals and small projects. They pick one asset or process to digitize and run a short pilot. Teams gather quality data and clean it before analysis. They choose cloud platforms that match security and latency needs. Next, they add models and dashboards and test results with field teams. They scale successful pilots in phases and measure outcomes each step. Training and change support keep staff engaged. Leaders also set simple governance rules for data access and vendor choices. This stepwise path lowers risk and builds momentum.
A practical rollout sequence looks like: define business objectives and success criteria; assess current data and OT/IT estate; select a low-risk pilot with measurable KPIs; implement sensors/edge/cloud stack and validate data integrity; develop analytics and operational workflows; run the pilot and collect feedback from operators; refine models and automation rules; then scale incrementally by asset class or geography. Critical enablers include cross-functional teams (engineering, IT, data science, operations), vendor management practices for interoperability, a data governance framework, and a learning plan for reskilling staff. Common pitfalls to avoid are trying to digitize everything at once, under-investing in data quality, and neglecting change management with frontline operators.
Measuring Success: KPIs, ROI, And Organizational Change Metrics
Operators track clear KPIs to show value from digital transformation in oil and gas. Common KPIs include uptime, mean time between failures, safety incident rate, and cost per barrel. Teams also track lead time to decision and forecast accuracy. For ROI, firms compare project costs to saved maintenance, higher production, and lower energy use. For change metrics, leaders measure user adoption, training completion, and time to act on alerts. Regular reviews link KPIs to business targets and guide next investments. Data-driven review helps justify budgets and keep teams focused.
To make measurements actionable, combine operational KPIs with financial and people metrics. For example, link uptime improvements to incremental production volumes and margin impact; convert reduced failure rates to avoided repair and safety incident costs; and measure time-to-decision to show how analytics shorten reaction times. On the organizational side, monitor digital adoption (percentage of shifts using new dashboards), model retraining cadence, and feedback loops from field teams. Establish a quarterly review rhythm that ties metric trends to decisions about scaling, further automation, or decommissioning legacy workflows. Over time, a balanced scorecard that mixes technical, financial, and change indicators will show whether digital transformation in oil and gas is delivering sustainable business value and cultural change.