Competitor analysis report helps teams see competitor strengths, weaknesses, and opportunities. The analyst reads market signals, collects data, and maps gaps. The report guides product, pricing, marketing, and sales decisions. It serves when a team plans a launch, revises strategy, or monitors threats. Readers get clear steps, metrics, and a template they can apply the same day.
Key Takeaways
- A competitor analysis report reveals rivals’ strengths, weaknesses, and opportunities to guide strategic decisions in product, pricing, marketing, and sales.
- Including consistent quantitative metrics like traffic, market share, pricing, and conversion rates allows teams to track competitors’ momentum and positioning effectively.
- Building a competitor analysis report involves defining scope, selecting relevant metrics, assigning roles, and maintaining regular updates to keep insights actionable.
- The report should be concise, featuring an executive summary, competitor profiles, comparative charts, and a clear action table to enable quick understanding and follow-up.
- Using a structured competitor analysis report helps teams identify market gaps and risks, enabling focused efforts that improve competitive advantage.
What Is A Competitor Analysis Report And When To Use It
A competitor analysis report states who the rivals are, what they sell, and how customers respond. The analyst lists direct and indirect rivals. The report compares features, pricing, distribution, and messaging. The team uses the report during planning, product changes, and quarterly reviews. They also use it when they see shifting customer behavior or new entrants. The report highlights gaps the team can pursue and risks they must address. The analyst updates the report on a regular cadence to keep it useful.
Key Metrics And Data Sources To Include
The analyst selects metrics that show scale, momentum, and differentiation. The report mixes hard numbers and human signals. The sources include analytics, market data, and qualitative research. The analyst cites each source and notes the collection date. The report uses consistent measures so the team can compare rivals over time.
Quantitative Metrics To Track (Traffic, Market Share, Pricing, Conversions)
Digital traffic shows visibility and demand. The analyst compares organic, paid, referral, and direct visits. Market share shows relative size in categories. The analyst estimates share from public filings, surveys, or third-party panels. Pricing reveals positioning and margin strategy. The analyst lists list prices, discounts, bundles, and subscription tiers. Conversion metrics show efficiency across the funnel. The analyst records landing conversion rates, trial-to-paid rates, and churn. The report flags metrics that move faster than peers and those that lag.
Step-By-Step Process To Build A Competitor Analysis Report
The analyst defines scope and goal first. They name the competitors to include and the time window. They choose metrics and sources that match the goal. They assign roles for collection, verification, and synthesis. They set deadlines and an update cadence. The team stores raw data in a shared folder and the summary in a single slide deck or document. They review findings with stakeholders and assign actions with owners and due dates. They treat the report as an operational tool, not a one-off exercise.
Report Structure: A Practical Template For Clear Findings And Recommendations
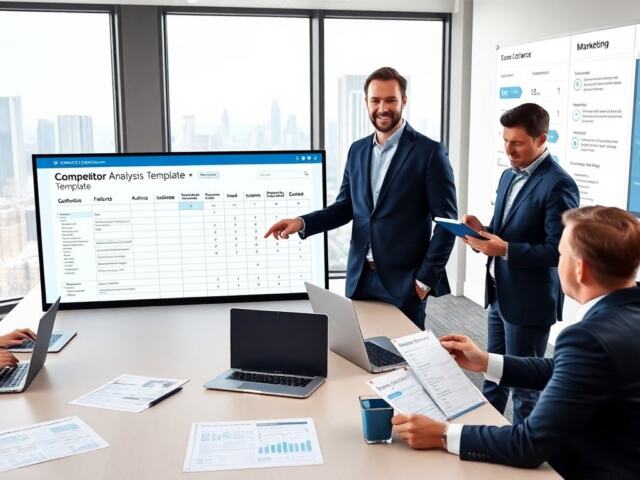
Title page states scope, date, and author. Executive summary lists three key findings and two recommended actions. Market snapshot shows size, growth, and main segments. Competitor profiles present a one-page view per rival with products, pricing, traffic, and positioning. Comparative charts show metrics side-by-side. SWOT-style bullets show where each rival excels and where they fall short. Opportunity map points to gaps the team can pursue with effort and expected impact. Action table assigns owners, deadlines, and success metrics. Appendix stores raw data, collection notes, and tool exports. The analyst keeps the template simple so teams can read it in five minutes and act quickly.